


INTRODUCTION
The World Health Organization (WHO) declared a public health emergency of international concern on January 30, 2020, and then a pandemic on March 11, 2020 following reports of more than 118,000 cases of coronavirus disease 2019 (COVID-19) from 114 countries [1,2]. The rapid and destructive transmission of COVID-19 led to severe healthcare burden and raised concerns about its transmission routes [3].
The first case of COVID-19 in Europe occurred in France on January 24, 2020, followed by rapid spread across the United States and Europe [2]. In response to this rapid spread of disease, numerous airlines worldwide canceled or reduced commercial flights, especially flights to China [2]. Also, in some countries, Government ordered school closures nationwide as an emergency measure to prevent the community spread of the infection and discouraged public activities [4].
Although the transmission path of COVID-19 has yet to be clearly identified, it is thought to be transmitted mainly through respiratory droplets [1]. In an effort to prevent transmission by respiratory droplets, recommendations and common practices for mask usage varied from country to country. Mask use in public spaces was attended with controversy in the United States during the early stages of pandemic. The US Centers for Disease Control and Prevention (CDC) currently recommends public wearing of masks [5]. The use of public mask is more pronounced in Asian countries, which is attributed to extensive experience with novel coronavirus epidemics in the past [5]. Meanwhile, many countries are focusing on the need to protect healthcare workers against COVID-19. For example, the US CDC and European Centre for Disease and Prevention recommend the N95 mask, while the WHO and the Public Health Agency of Canada recommend medical masks for prevention of COVID-19 transmission [1]. These countermeasures against the spread of viruses in different countries suggest that the virus spread occurs by droplets mostly, suggesting the need for further investigation into this mode of propagation.
The WHO statistics suggest that Asian countries had lower incidence and fatality rates compared with other countries in the West or elsewhere. Several cultural differences may play a role in this phenomenon, and language is a possible factor underlying the differences in incidence and fatality rates. Further, the differences in oral or nasal flow in each language may contribute to the respiratory droplet characteristics [6–26]. Respiratory droplets are carriers of a variety of respiratory pathogens, including measles virus, influenza virus, and Mycobacterium tuberculosis, severe acute respiratory syndrome coronavirus 2 (SARS-CoV-2) is no exception. The detection of large viral loads of SARS-CoV-2 in the oral fluids of COVID-19–positive patients, including asymptomatic ones supports this hypothesis [27].
The probability of virions in the respiratory droplets during speech is proportional to their initial hydrated volume. This hydrated volume is related to speech characteristics according to language. According to the independent action hypothesis (IAH), each virion has an equal, nonzero probability of inducing an infection. The respiratory droplets have a significant potential to transmit COVID-19 between humans, based on IAH. Considering that frequent person-to-person transmission has been reported across the global community, it appears likely that IAH is applicable to COVID-19 [27].
Therefore, we tested the hypothesis that the vocal characteristics of various languages affected the early transmission of COVID-19. Our study analyzed the cumulative incidence rate using WHO data starting with the first confirmed patient until the peak of transmission. In addition, the linguistic features were analyzed by quantifying the numerical values of nasometry in normal subjects, followed by meta-analysis based on this data. Finally, a correlation analysis was performed between the two outcomes.
MATERIALS AND METHODS
This study consists of two main methodologies including meta-analysis based on nasometry data of normal adults and the cumulative incidence rate using WHO data. The systematic review and meta-analysis were performed according to the standard Preferred Reporting Items for Systematic Reviews and Meta-Analyses (PRISMA) statement.
1. Data sources and literature searches
We conducted electronic literature searches of PubMed, EMBASE, Cochrane, and KISS starting from the earliest available date through July 2020. The controlled subject headings of MeSH (medical subject headings terms) and text keywords were used for PubMed search, and the same reference search was adopted for the rest of the electronic database. The search was conducted without any language constraints. Two authors also independently manually searched the reference lists of identified publications for additional studies. The search formula was based on a combination of key terms: (‘speech production measurement’ or ‘voice quality’ or ‘speech’ or ‘verbal behavior’ and ‘nasalance,’ and ‘nasometry’ or ‘nasometer’ or ‘nasal resonance’).
2. Study selection
The inclusion criteria were: (1) interventions including measurements via nasometry equipment; (2) comparisons involving speech samples of oral text, oronasal text and/or nasal text; and (3) outcomes including mean differences (MD) of nasalance. Duplicated publications were excluded, as were review articles, case reports, conference abstracts, editorials, letters, and guidelines, which did not contain original data. Two of the authors (S.R.S. and J.H.K.) independently screened the titles and abstracts of all articles using predefined inclusion criteria. The full-text articles were examined independently by two of the authors (S.R.S. and J.H.K.) to determine whether or not they met the inclusion criteria. The same authors independently extracted data using a data extraction form. The final articles for inclusion were decided by all the investigators. References and data for each study included were carefully cross-checked to ensure that no data overlap occurred and the integrity of the meta-analysis was maintained.
3. Meta-analysis assessment of outcomes and statistical analysis
All variables were provided as continuous data. The following information was collected from the selected studies: basic study information (first author, publication year, country, language family, language, number of patients, mean age, and sex) and MDs (nasalance score of oral, oronasal, and/or nasal text). The MDs along with their 95% confidence intervals (Cls) were calculated for continuous variables. The random-effects model published by DerSimonian and Laird [28] was used to obtain the pooled overall MD and 95% CIs for outcomes. Meta-regression analysis was conducted for each moderator. To examine potential moderators (language family, sex, and age), we used a restricted maximum likelihood estimator of the variance of the true effects. A two-sided P-value ≤0.05 or not containing the null value (MD=0) within the 95% was considered significant. The above-mentioned analyses were conducted with R software ver. 3.6.0 (The R Foundation for Statistical Computing, Vienna, Austria).
4. Quality assessment
The Newcastle-Ottawa quality Scale was used as an indicator of quality for the cohort studies. We assessed the following four parameters: (1) appropriate selection, (2) comparability of research design or statistical analysis, (3) outcome/exposure ascertainment, and (4) research procedure. We graded each parameter using a star; a study was awarded a maximum of one star for each item in the selection and outcome/exposure parameters and a maximum of two stars for comparability.
5. Assessment of heterogeneity
Statistical heterogeneity was evaluated using the Cochran’s Q test and the I2 statistic. Significant heterogeneity between studies was indicated by either a Cochran’s Q statistic P<0.1 or an I2 statistic >50%. However, a non-significant χ2 test result (P≥0.1) or I2 statistic (≤50%) indicated lack of heterogeneity but did not necessarily imply homogeneity due to insufficient statistical power to detect heterogeneity. Therefore, we used a random-effects model of analysis.
6. Assessment of potential publication bias
The funnel plot explains the publication bias using standard error as the measure of study size and MD measures of treatment effect. In the absence of publication bias, the studies will be distributed symmetrically based on the combined effect size. In addition, we conducted Begg & Mazumdar rank correlation test and Egger linear regression analysis for publication bias [29].
7. Cumulative incidence rate of COVID-19
In order to measure the velocity of airborne transmission by language family, we calculated the cumulative incidence rates of COVID-19 of language families using the country’s daily reported cases of COVID-19 provided by the WHO [30] and the country population by the United Nations [31].
As of July 5, 2020, in particular, Saudi Arabia and the United States showed double peaks, and based on the second peak, the cumulative impact rate was calculated. However, the incidence rate of COVID-19 in Chinese was excluded because it was suspected as an outlier value. Finally, the differences between language families were evaluated based on the meta-prevalence of cumulative incidence rate.
8. Correlation between cumulative incidence rate of COVID-19 and nasalance
The four language families included Arabic, Chinese, European, and Ural-Altaic. The European language family has a linguistic lineage that includes English, Greek, Dutch, French, Spanish, and Flemish. The Ural-Altaic language family includes Korean and Japanese. Spearman’s rank correlation analysis was used to determine the relationship between the cumulative incidence rate of COVID-19 and nasalance.
RESULTS
1. Study selection
The initial search identified a total of 426 articles from electronic databases (PubMed, 197; Cochrane, 0; Embase, 229). The 153 excluded studies contained overlapping data or appeared in more than one database. Upon further detailed review, an additional 13 papers were eliminated as they were review studies and non-target diseases. After screening the titles and abstracts, 53 studies were deemed eligible for intensive screening, and 34 of them were further excluded for the following reasons: no normal adult data (n=15) and no nasometry score data (n=18). Finally, 19 studies met our selection criteria for qualitative and quantitative assessment [6–26] (Table 1, Supplement 1). In all studies, the nasometer models 6200, 6400, 6450 (Pentax Medical, Monvale, NJ, USA) and Tonar II (Fletcher, Randolph, NJ, USA) were used to measure the nasal sound. The speech sample of nasal resonance was analyzed for oral text, oronasal text, and/or nasal text.
2. Outcomes
The pooled overall MDs for oral text nasalance among language family groups were 14.655 (95% CI, 7.986–21.324) in Arabic, 24.441 (95% CI, 17.920–30.962) in Chinese, 14.964 (95% CI, 13.677–16.251) in European, and 11.437 (95% CI, 9.880–12.994) in Ural-Altaic. The heterogeneity test showed a P-value <0.01 and the Higgins’ I2 was 99.5% (Fig. 1). The pooled overall MDs for oronasal text nasalance among language family groups were 38.233 (95% CI, 33.339–43.126) in Arabic, 48.609 (95% CI, 43.379–53.839) in Chinese, 35.911 (95% CI, 31.735–40.087) in European, and 31.937 (95% CI, 27.847–36.028) in Ural-Altaic. Heterogeneity was significant (P<0.01), and the Higgins’ I2 was 99.6% (Fig. 2). The pooled overall MDs for nasal text nasalance among language family groups were 47.470 (95% CI, 29.143–65.797) in Arabic, 58.887 (95% CI, 51.382–66.391) in Chinese, 47.642 (95% CI, 39.801–55.484) in European, and 62.038 (95% CI, 58.628–65.448) in Ural-Altaic. Heterogeneity was significant (P<0.01), and the Higgins’ I2 was 99.8% (Supplement 2).
3. Moderator analyses
Table 2 provides an overview of the moderator analyses. The meta-regression analysis revealed that the language family was statistically significant in oral text (P<0.001) and oronasal text (P=0.043). Further detailed analysis revealed high scores of nasalance for Chinese, whereas Ural-Altaic showed low nasalance score in oral text and oronasal text. With respect to age group, those over 40 years old in oronasal text had high nasalance scores (P=0.023). However, no sex-based difference was found.
4. Cumulative incidence rate of COVID-19
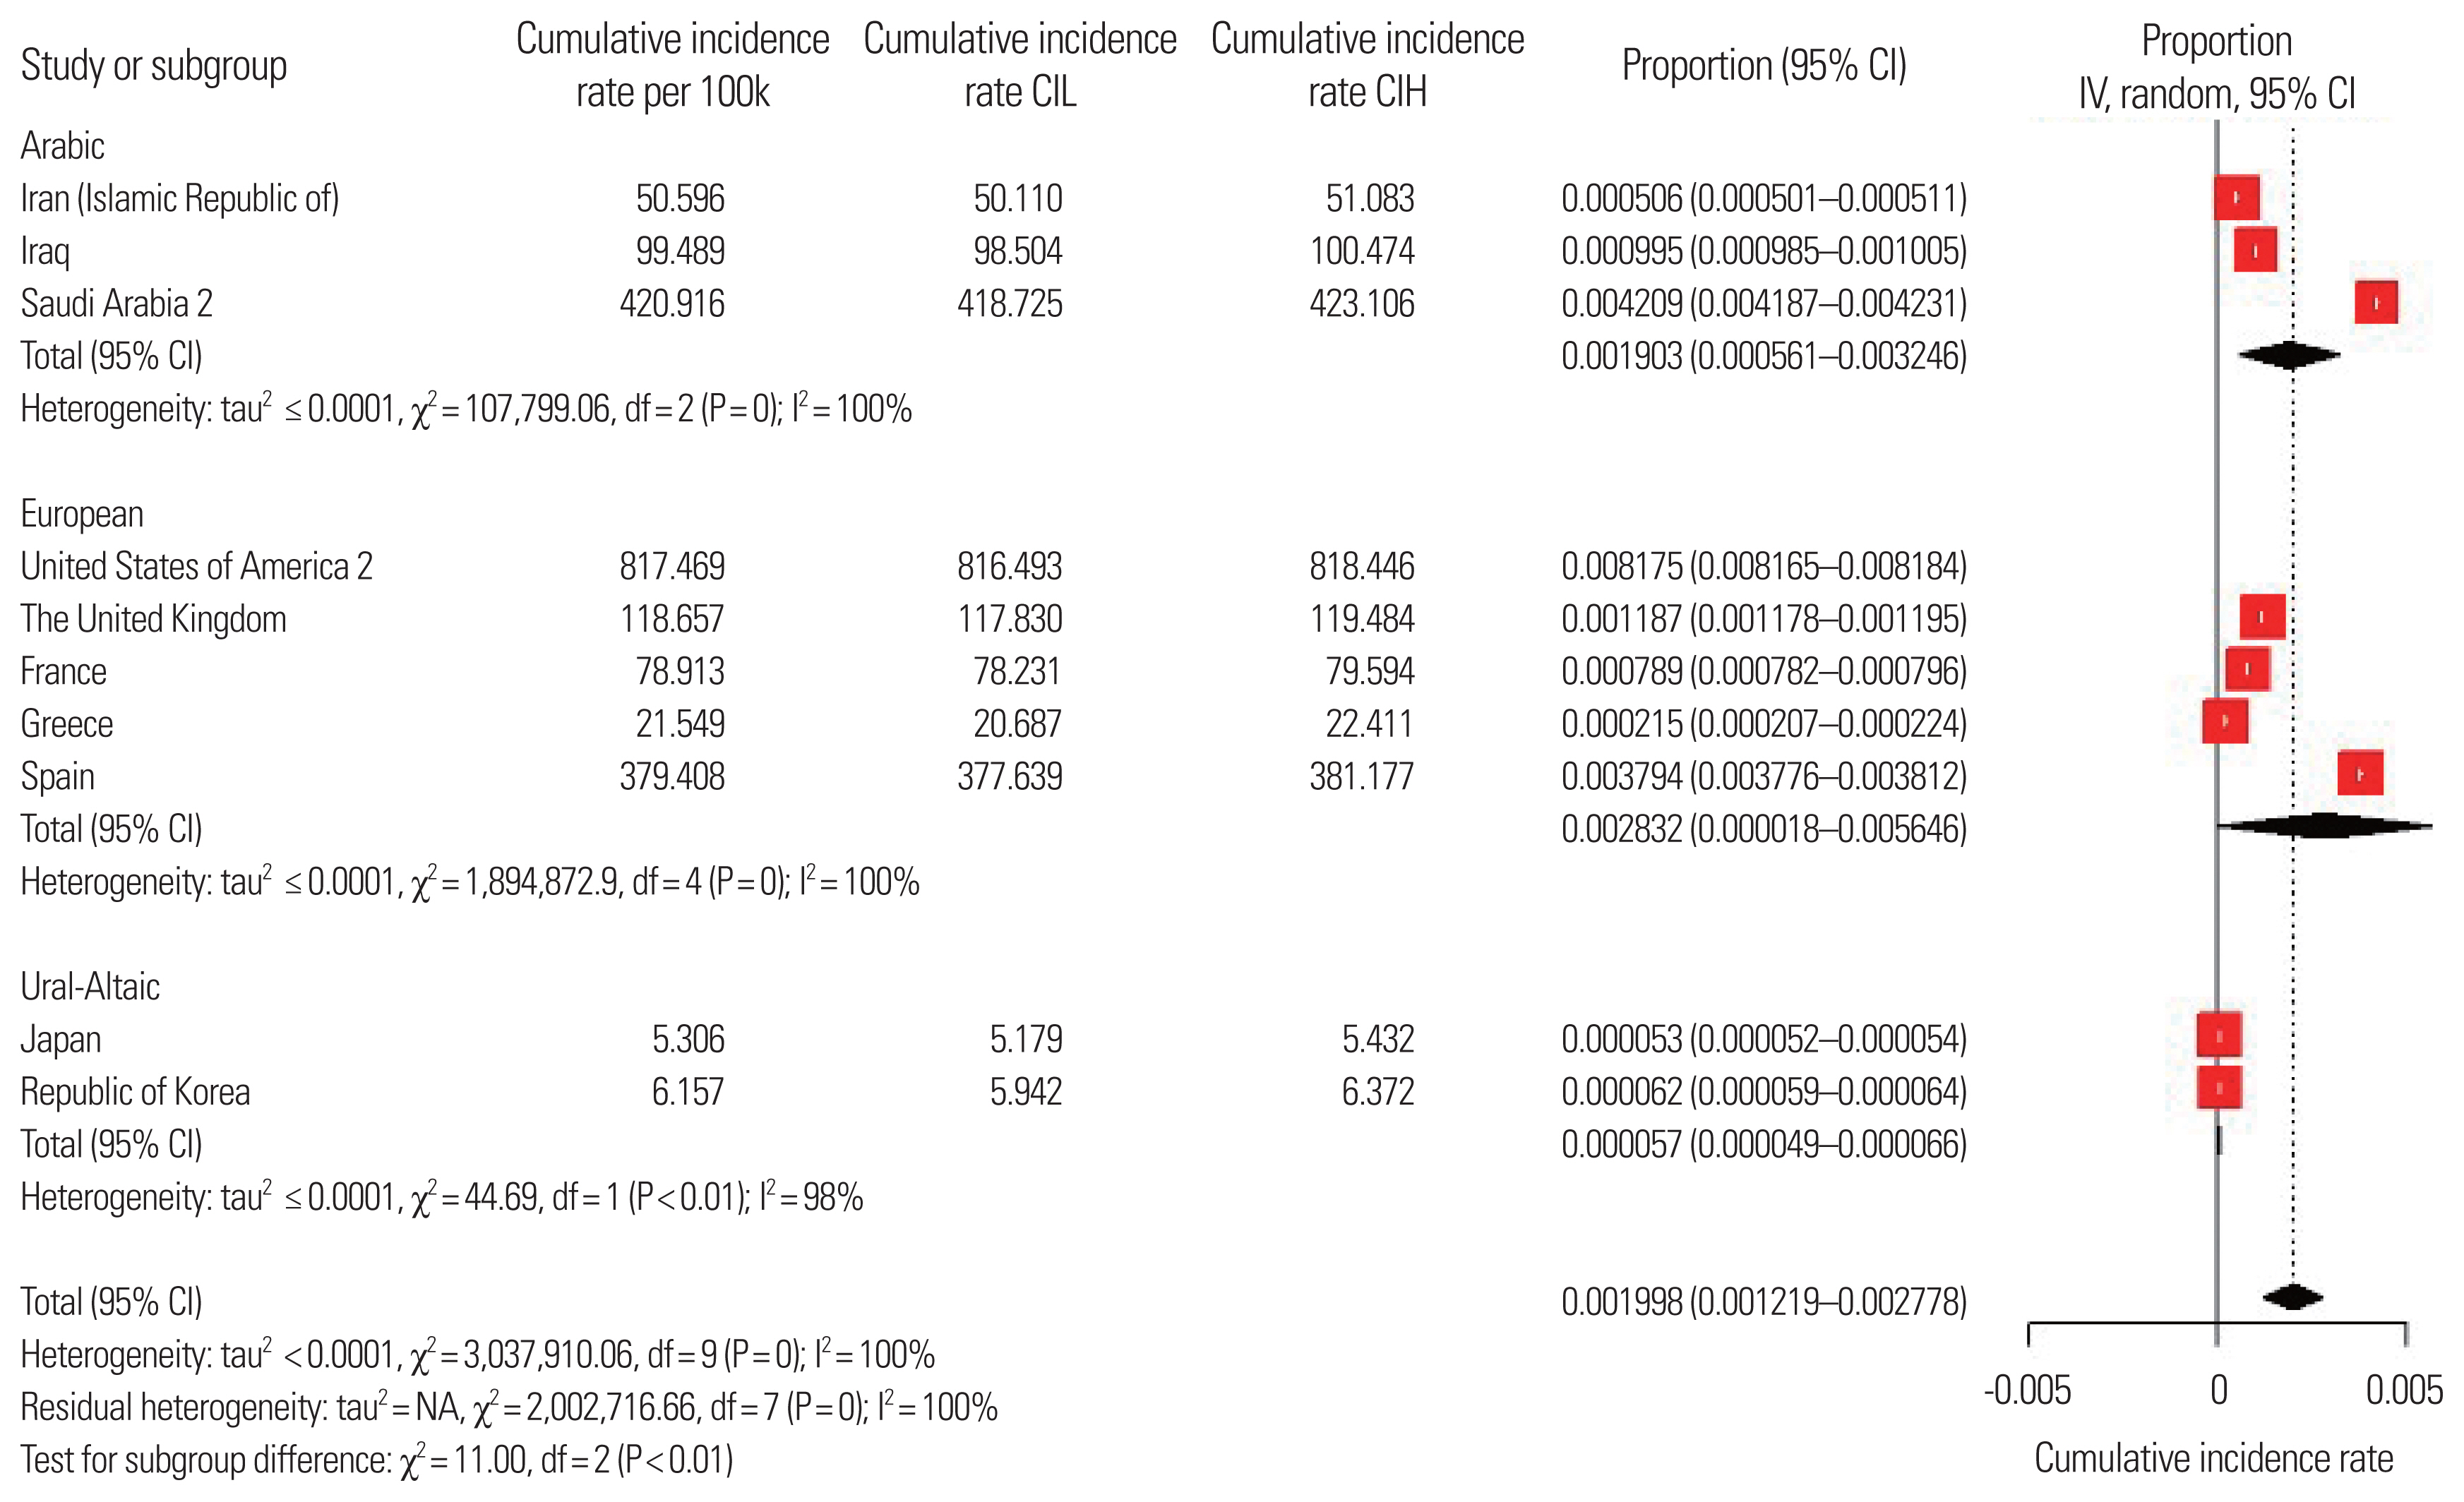
The pooled overall MDs for cumulative incidence rate of COVID-19 were: 190.3 (95% CI, 56.10–324.60) in Arabic, 283.20 (95% CI, 1.80–564.60) in European, and 5.70 (95% CI, 4.90–6.60) in Ural-Altaic. Significant heterogeneity was found (P<0.01). The Higgins’ I2 was 99.8% (Fig. 3). The meta-regression analysis showed that the cumulative incidence rate of COVID-19 associated with Ural-Altaic was significantly lower than in other language families (P=0.016).
5. Correlation between cumulative incidence rate of COVID-19 and nasalance
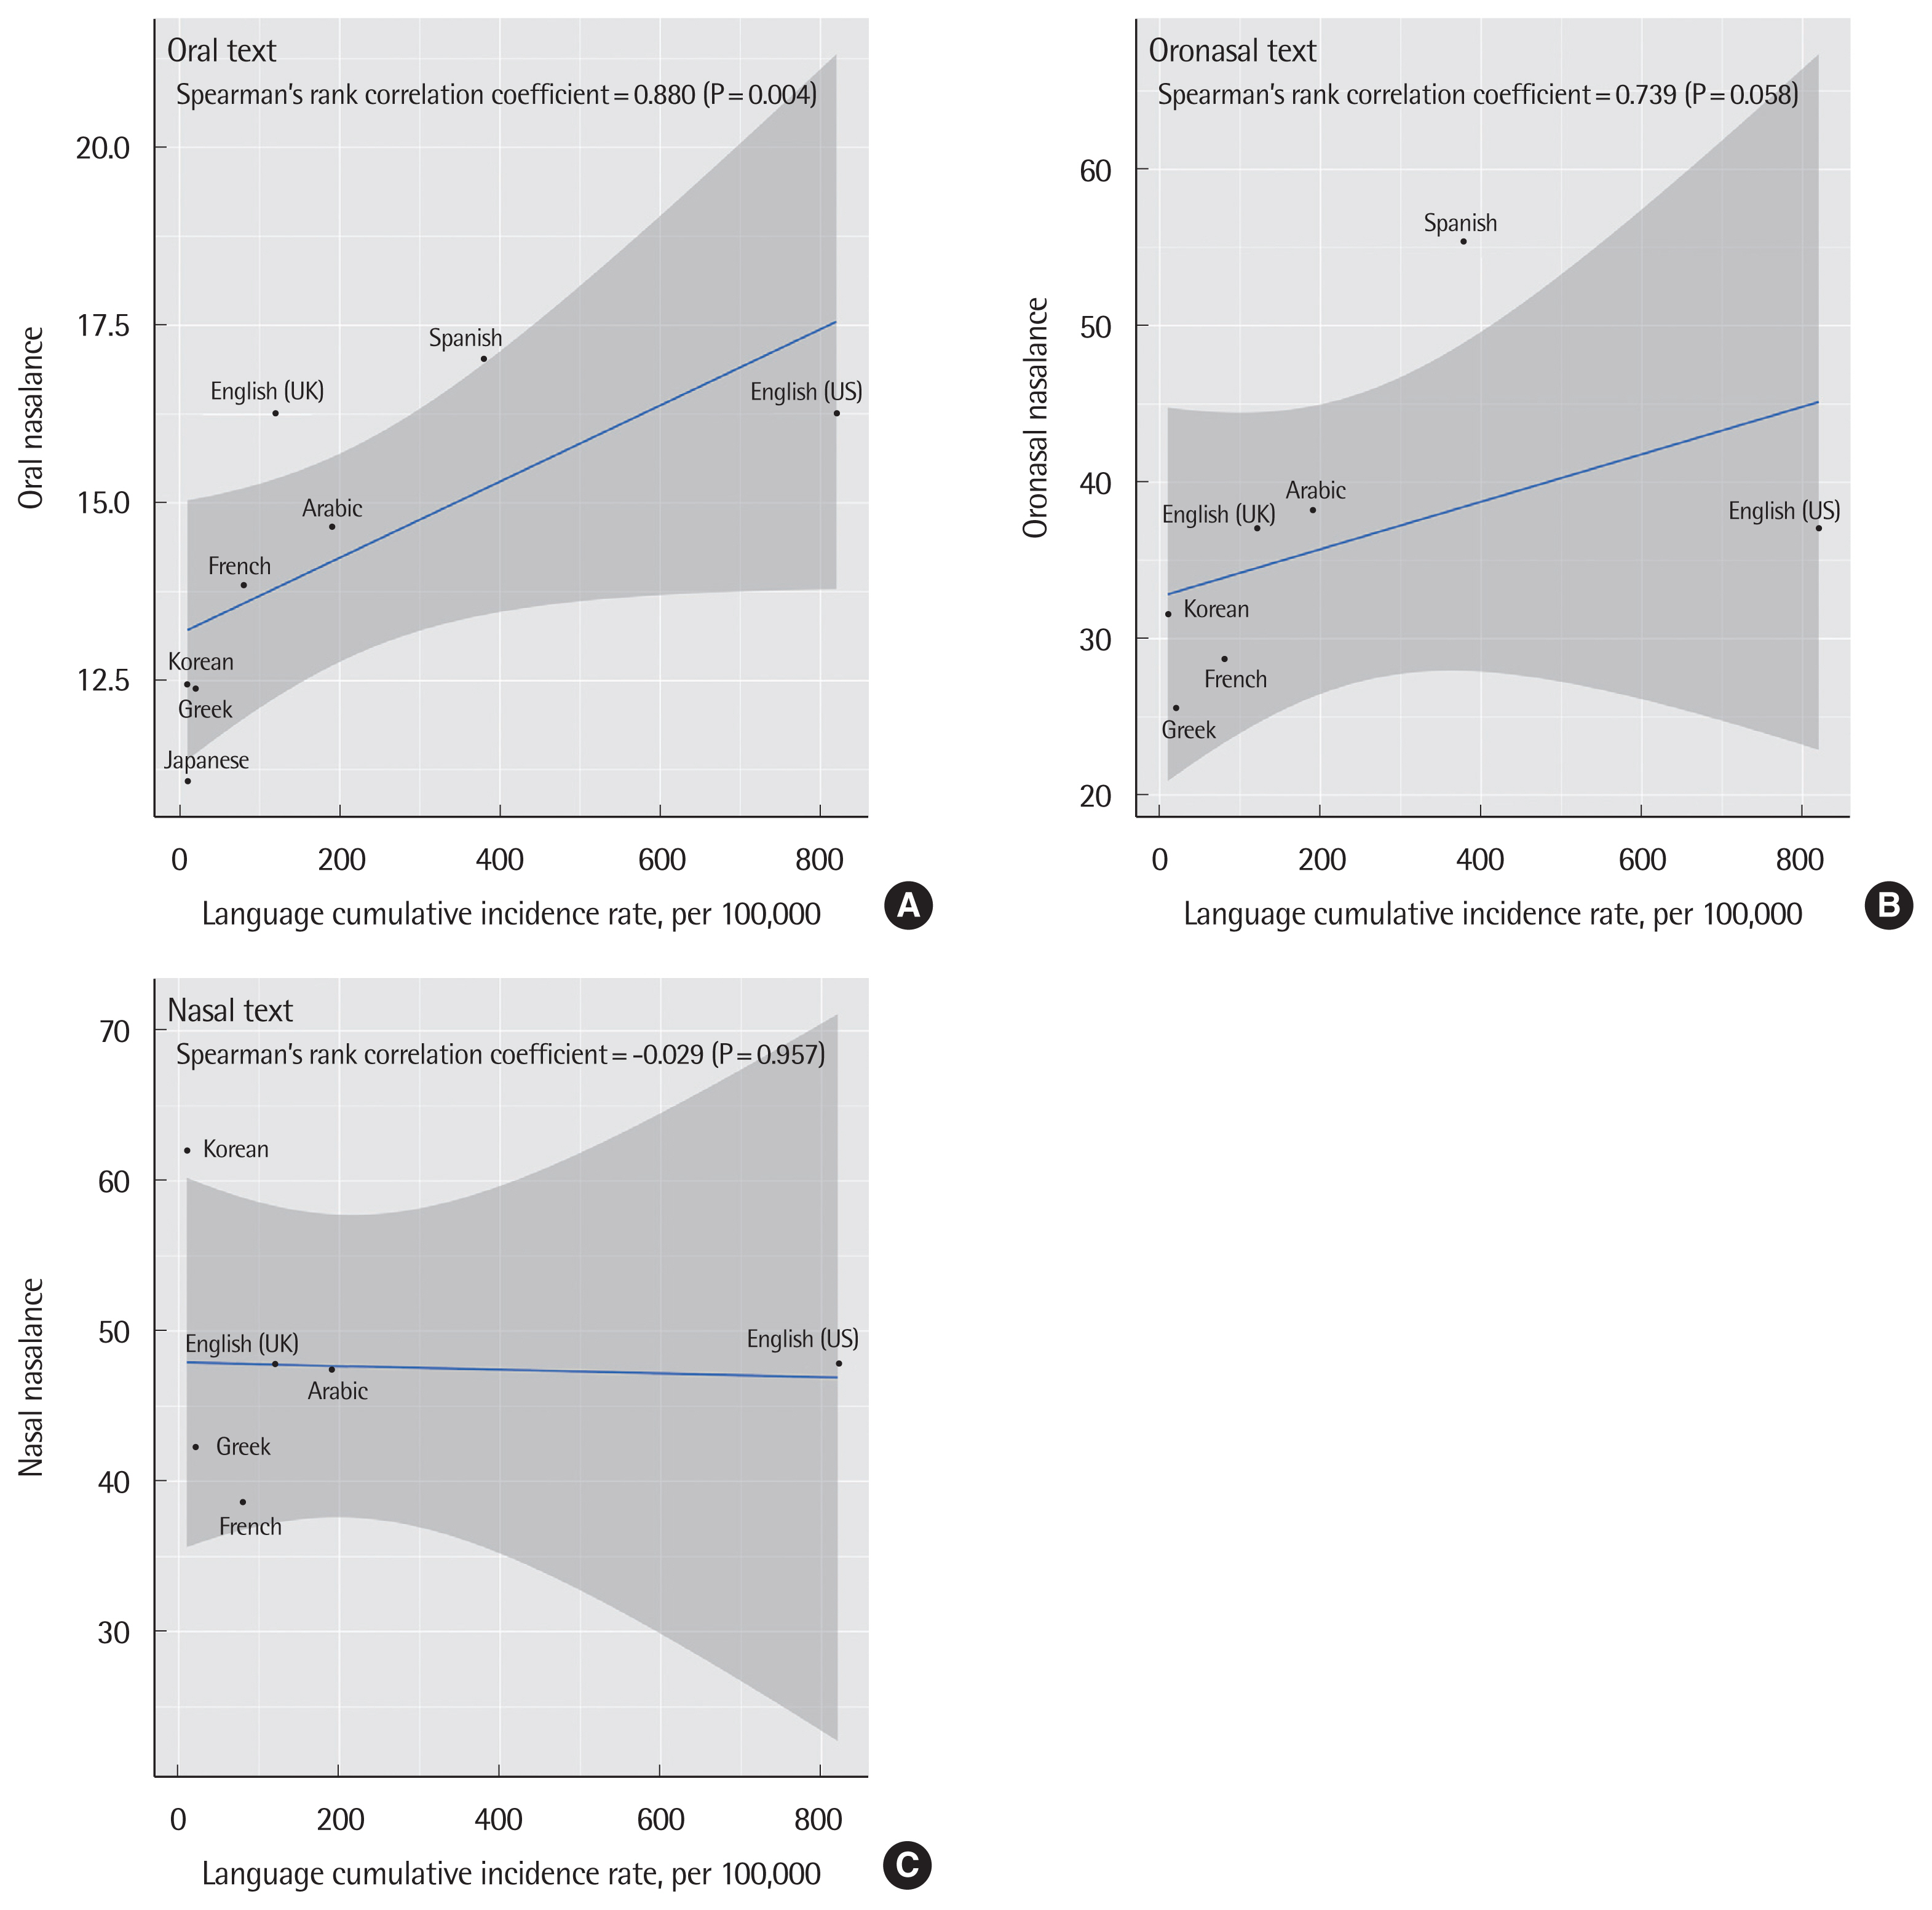
The Spearman’s correlation coefficients were 0.880, 0.739, and −0.029 for oral, oronasal, and nasal text nasalance, respectively. Oral text nasalance was only significant (P=0.004) (Fig. 4).
6. Quality assessment
We evaluated the methodological quality of each included study according to the Newcastle-Ottawa Scale. The quality assessments of the included studies are shown in Supplement 3. The selection category of all included studies was low in almost all domains except for the outcome of interest undetected in the start domain. The comparability and the outcome categories were low in all domains except for adequacy of follow-up domain.
DISCUSSION
This study is the first trial to investigate the effect of linguistic features on the outbreak of COVID-19, especially in the early transmission phase. The nasometry scores in the East, especially Japan, were relatively low, which was intuitively clear based on the slow initial incidence and transmission in the East. A positive correlation was confirmed by correlation analysis.
Our study hypothesized that differences in language characteristics exist in oral or nasal flow during speech among countries, which affects the initial spread of COVID-19 in each country. The mechanistic hypotheses emphasized the role of dramatic expiratory events including coughing and sneezing in airborne infection disease transmission. Normal speech also yields large quantities of particles that carry various infectious pathogens although they are not visible [32]. According to a recent report, airborne human transmission of infectious pathogens during speech by aerosol particles was affected by the specific phonetic characteristics of the language spoken by each speaker [33].
Our study showed the linguistic differences in nasometry results. Oral nasometry score of Ural-Altaic was 11.737 (95% CI, 12.833–17.477), which was the lowest overall compared with Western and Arabic language. Moreover, the oronasal score showed similar findings and meta-regression analysis showed that language family and individual language were significant moderating factors affecting the oronasal nasometry score.
According to the WHO, SARS-CoV-2 transmission is primarily caused by coarse respiratory droplets and contact routes. An experimental study (a study by van Doremalen and his colleagues in 2020) using a nebulizer revealed that SARS-CoV-2 was viable in aerosols (<5 mm) for 3 hours (the study duration) [5]. Also, based on the IAH hypothesis, respiratory droplets play a key role in COVID-19 epidemic, considering that frequent person-to-person transmission has been reported in community and health care settings [27]. Airborne transmission is facilitated not only by dramatic expiratory events but also by normal speech. The type of speech is based on the type of language, and each language is associated with a different airborne transmission rate as shown by nasometry scores. In our study, the oral nasalance score was significantly correlated with the cumulative incidence rate in each country (correlation coefficient=0.880, P=0.004), and oronasal score showed borderline significance (correlation coefficient=0.739, P=0.058).
It is globally recognized that respiratory droplets are the key cause of transmission of COVID-19 infection, and preventing transmission of infection depends on the effective use of personal protective equipment (PPE) such as masks. As the COVID-19 pandemic accelerates, global health care systems have been overwhelmed by the explosive increase in the number of infected patients and a critical shortage of PPE [34]. Therefore, various studies were conducted to cope with the lack of masks. The CDC recommends optimized use of face masks during the pandemic according to three levels of operational status: conventional, contingency, and crisis [34]. Also, based on the data suggesting that medical masks and N95 respirators offer similar protection against viral respiratory infection including coronavirus, reports recommend the reservation of N95 respirators for those engaged in high-risk, aerosol-generating procedures during this pandemic [1].
The emphasis should be on the role of language-specific vocal characteristics in the transmission of viruses. The probability that respiratory droplets cause infection when emitted by a virus carrier should be considered in determining the duration of large, airborne droplet nuclei proportional to d ([diameter of droplet]−2) and the probability that droplets encapsulate at least one virion (proportional to d3). Combining the two parameters above, the probability that the respiratory droplet spreads the virus is proportional to the droplet diameter. The lateral spread of the droplets is determined by the distance from the speaker’s mouth during their downward route based on the total volume and flow velocity of exhaled air. The flow velocity of air is related to phonation, and the total volume and droplet count increase with loudness [27]. Phonation and loudness are characteristics of each person, but are common to languages that are measured at a similar level in those speaking the same language. Therefore, given that respiratory droplets are the core cause of infection transmission, the speech characteristics of each language can also be considered as an important factor.
Although our study is the first of its kind, several limitations exist due to the intuitive interpretation, rather than a causal analysis. Firstly, the analysis of the cumulative incidence rate was based on calculations using the first peak in the case of countries with multiple peaks. The accuracy of this method to calculate propagation speed is not supported by evidence. Therefore, an additional feasibility study is needed. Second, this study did not consider epidemiological variables, which affect airborne transmission. In addition to transmission by respiratory droplets, various habitual or cultural factors such as shoes and clothes may have influenced the rate of transmission regionally. In a study comparing the number of COVID–19 cases and deaths in countries that followed the cultural practice of removing shoes indoors and those that do not, significantly fewer COVID–19 deaths were detected in countries that followed the cultural practice of removing shoes indoors [2]. Another study that analyzed swab samples collected from potentially contaminated objects in the intensive care unit and general wards where patients with COVID-19 infection stayed showed that COVID-19 was widely distributed in the air and also on object surfaces [3]. Therefore, it is necessary to design an additional study that excluded the influence of these additional factors. Lastly, the correlation analysis between cumulative incidence rate and nasometry findings was performed without considering other covariates.
In conclusion, our study showed the possible correlation between language characteristics and early spread of COVID-19. Although this study showed no direct relationship, different language characteristics represented by nasometry scores affected the early spread of COVID 19 especially under conditions where no facial mask was recommended. Additional studies are needed to validate our preliminary outcomes considering various epidemiological and behavioral factors including mask wearing.